 Mo Free Apps
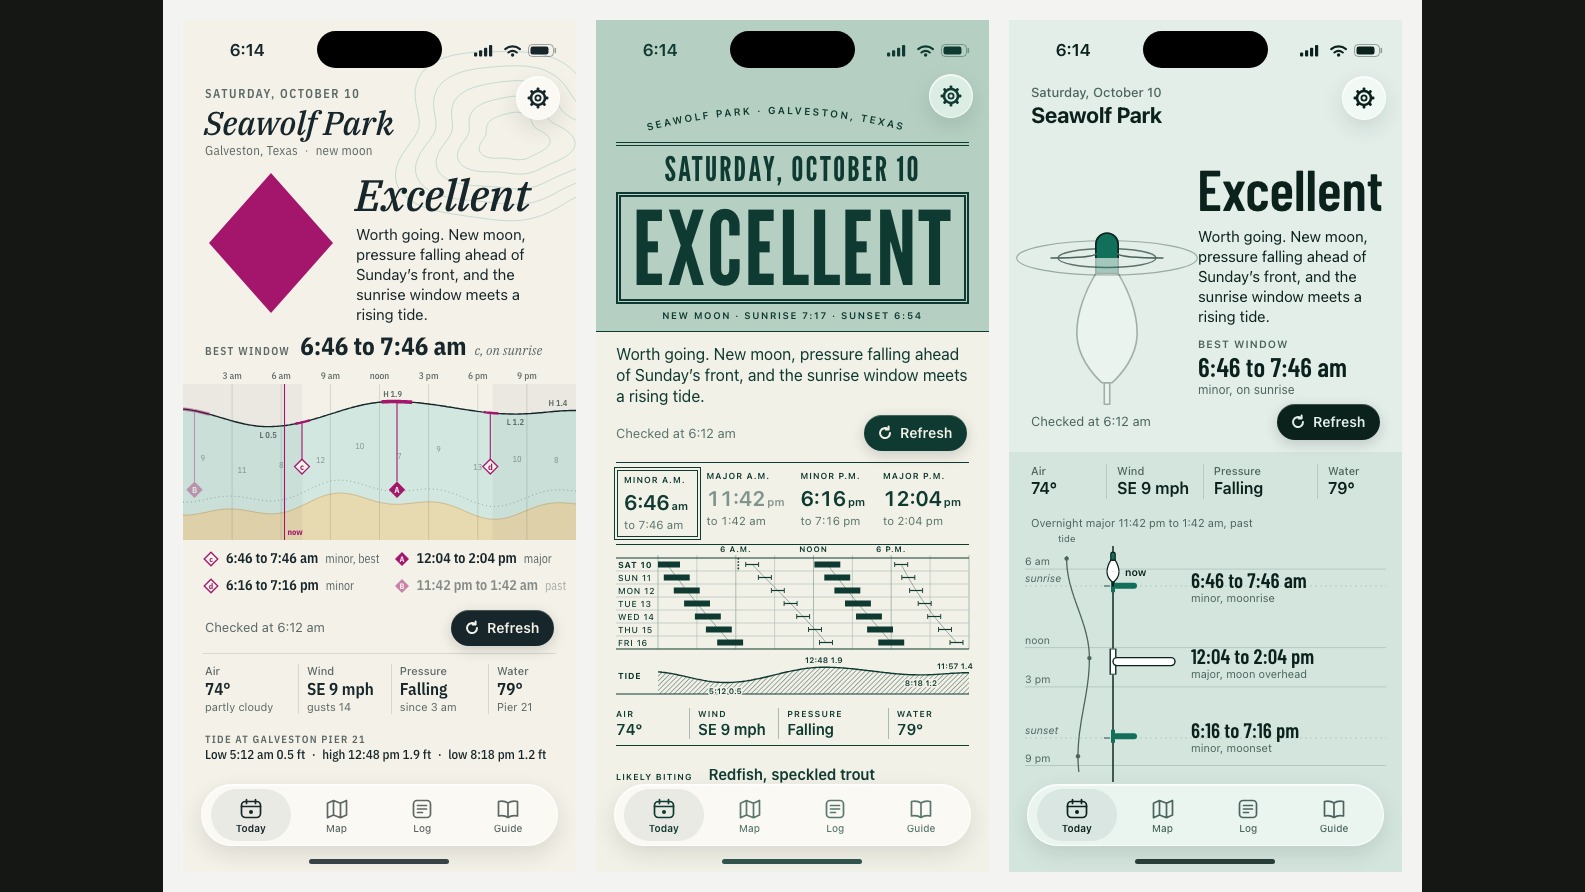
Same thing I did for Gymini, because it worked. Before anybody styles a screen, I get three real directions built as phone mocks of the actual screens, all on the same day and the same water so I'm comparing the look and not the data. This time it was Saturday October 10 at Seawolf Park in Galveston, a real new moon, with the fishing windows actually computed.
Chart Paper puts the day on a nautical chart. Paper ground, the shallows tinted sea green, and the day's windows hang from the tide line as magenta lead lines ending in lettered diamonds, the way a real chart marks tidal streams. The verdict is one big diamond: solid for excellent, open for fair, crossed for skip. You can read it from across a boat with the word covered.
Tide Ledger is a one-ink printed tide book, with the week drawn as a slanted timetable because the moon runs about fifty minutes late every day. It's the prettiest graphic of the three. It also fails the test that matters: cover the word and you can't tell fair from skip.
The Float is deep green water and a bobber for the verdict. It goes under when the day is good and lies flat when it isn't. The most human of the three, and the one I thought I'd pick.
I went with Chart Paper. The diamond is the strongest mark at thumbnail size, which is the size that ends up on a widget and an icon. One open question: the chart magenta is close to a colour another app in the suite already owns, so that may shift. The style card is rewritten around the chart tonight and the engine work keeps going underneath it.
Posted on X the same day. Replies there, or email votiquellc@gmail.com.